Learn about the latest statistics and insights into the rapidly changing world of mobile commerce with these 69 illuminating statistics.
From the pandemic’s effects to the most popular shopping apps, this article provides the most up-to-date snapshot of the m-commerce industry.
Key Takeaways:
- Consumers spend more time on mobile shopping apps than desktop shopping
- More than 80% of mobile shopping carts are abandoned
- Mobile Commerce is expected to have 30.7% CAGR until 2028
General Mobile Commerce Statistics
50.9% of Weekly Online Shoppers Prefer Mobile Shopping
Of the global population that admit to making online purchases every week, the split between mobile and non-mobile use is pretty evenly split with 49.1% using a non-mobile device versus 50.1% mobile users.
59.8% of Consumer E-Commerce Spending Made via Mobile Phones
Mobile commerce spending has boomed in recent years, with Covid restrictions driving more people than ever before to see it as a viable method of shopping and making payments. In the last year, the percentage of e-commerce spending attributable to mobile phones was 59.8% which is a 1.2% increase over the same period a year earlier.
Amazon Was the Most Used Mobile Shopping App
| Rank | Shopping App |
|---|---|
| 1 | Amazon |
| 2 | Shopee |
| 3 | FlipKart |
| 4 | AliExpress |
| 5 | Lazada |
| 6 | MercaDoubre |
| 7 | Shein |
| 8 | Meesho |
| 9 | Ebay |
| 10 | Myntra |
Based on the number of global active users between January and December 2022, Amazon was the most popular mobile shopping app in the world last year. The top five was rounded out by Shopee, Flipkart, AliExpress, and Lazada.
4.16 Billion People Made Digital Payments
Digital payment systems continue to see growth year over year, with more than 4 billion people last year using digital payment methods. That’s an extra 321 million consumers adopting digital payment methods, an 8.1% increase over the same period a year earlier.
~70% of Internet Users Use Mobile Shopping Apps
The latest statistics show that 69.4% of internet users are using at least one mobile shopping app on their mobile devices. This practice peaked during the pandemic lockdowns, has fallen slightly since then, but continues to trend upwards as younger generations continue to enter the workforce.
Fashion Retailers Convert 89.3% of Mobile Traffic into Sales
Fashion retailers have an excellent record for turning mobile traffic into sales, with the most recent figures showing an incredible 89.3% conversion rate! With more shoppers making mobile their preferred shopping method every year, it would be foolish for retailers not to prioritize their mobile-oriented websites and apps.
44% of Travel Industry Sales Completed on Mobile
The rise of travel apps has made the process of booking your yearly holiday easier than it has ever been. The latest figures show that about 44% of all completed travel sales are made via a mobile device.
Shopping Cart Abandonment Rate Highest on Mobile
The average cart abandonment rate on mobile devices is 69.02% while desktop devices saw a relatively low abandonment rate of 62.11%. There are several reasons why abandonment rates are so high on mobile. Consumers give the following primary reasons: poorly optimized mobile websites and apps, security concerns, and too many order bumps and add-ons.
Amazon Mobile App Had 197 Million Monthly Users in 2022
Amazon is a global behemoth of the e-commerce industry and its focus on the mobile shopping experience it provides has really helped cement that position. With its well-optimized, fast, and easy mobile shopping websites and apps, there were an average of almost 200 million monthly users last year.
In the U.S., 73% of E-Commerce Is M-Commerce
M-commerce becomes more valuable to businesses every year in the U.S.. As people increasingly turn to mobile devices as their preferred method of accessing the apps and content they love, businesses have seen a corresponding increase in consumers’ desires to shop that way too. Today, almost three-quarters of all e-commerce sales in the U.S. are made via mobile devices.
Mobile Payment Market Has Expected 36.2% CAGR
The U.S. mobile payment market shows no signs of slowing down and was recently valued at somewhere between $52.21 billion and $72 billion depending on the source and studies used. As the technologies and infrastructures involved mature, the compound annual growth rate (CAGR) is predicted to be between 27.2% and 36.2% between now and 2030.
Global Shopping Cart Abandonment Rate Is 84%
This looks like a worryingly high percentage; however, there are several reasons that can be attributed to this statistic. Poorly designed mobile shopping experience is a leading reason for cart abandonment, as are slow loading times, requiring a consumer to sign up for an account, and high shipping fees. Possibly the biggest reason is that many consumers use their mobile devices to “window shop” or research products before they complete a purchase on a different device or in person.
6% of All Retail Sales in 2023 Expected to Be Mobile Commerce Sales
According to recent reports, global m-commerce sales are expected to reach more than $1.4 trillion in 2023, accounting for 6% of total retail sales worldwide. This represents a significant increase from the 4.3% share that m-commerce held in 2020.
In 2022, Mobile Sales During Cyber Week Generated over $17.9 Billion
Cyber Week (Thanksgiving to Cyber Monday) saw U.S. consumers spend an eye-watering $35.27 billion online, a 4% increase over 2021. What’s interesting about this staggering online consumer spending is that for the very first time, the majority of those sales (51%) were made through mobile devices.
Mobile Coupon Industry Worth $509.7 Billion
Digital vouchers that can be redeemed through a mobile device have grown in popularity alongside mobile commerce. The most recent estimates value the mobile coupon industry to be worth $509.7 billion globally, and experts are predicting it to increase to roughly $1.6 trillion by 2030.
80 Million People Using Mobile Payments in the U.S.
The mobile payment platform space in the U.S. has had 24% growth over the last 3 years, attracting an extra 15.5 million users. This growth has been driven in large part by improving mobile accessibility, security, and convenience. If the trend continues in this way, some forecasts predict that mobile payments will surpass credit card and cash payments by 2025 and account for 27.8% of all point-of-sale transactions.
Mobile Shopper Demographics
Mobile Shoppers by Age
90% of U.S. Consumers Aged 25 – 34 Prefer Shopping with Their Phone
Younger millennials overwhelmingly prefer to use their mobile devices to do their online shopping. This is true with all millennials, particularly younger millennials, as 9 out of 10 report that it’s their preferred way to shop. Gen-Z shoppers also prefer to use mobile devices more than any other method.
Millennials Are Most Regular Mobile Commerce Shoppers
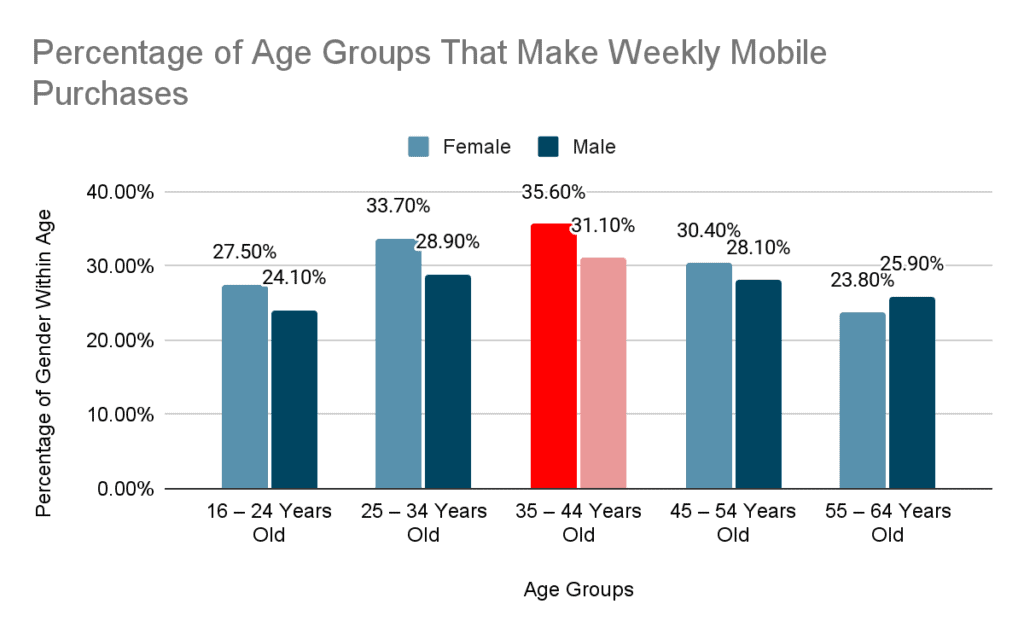
So-called bridge millennials (those aged 35-44 years old) are the age group that is most likely to make purchases with a mobile phone each week. 35.6% of females and 31.1% of males within this age category state that they complete a purchase this way every single week.
Younger millennials (those aged 25 to 34 years old) are the second-most represented group, with 33.7% of females and 28.9% of males agreeing that they make a mobile purchase every week.
Millennials Use Mobile Payment Services the Most
The millennial age group are the most likely to use a mobile payment service each month with bridge millennials (35 – 44 years) using them ever-so-slightly more than younger millennials (25 – 34 years).
Surprisingly, there isn’t as much of a difference in the percentage of each age category using these services as you might think, with there being only a 5% – 10% difference in use.
Mobile Shoppers by Gender
Females More Likely to Shop on Mobile than Males
When it comes to weekly online shoppers, females across almost every age group are more likely to use their mobiles to make a purchase than a non-mobile device than males. Only the 55 – 64 age group has males as more likely than females to complete one of their weekly purchases using a mobile device.
39.9% of the Male Population Made a Mobile Purchase
Online shopping has exploded in popularity in recent years, and last year saw 39% of the global population make at least one mobile purchase last year. Slightly more males than females completed a mobile purchase, with 39.9% of males admitting to having made a mobile purchase compared with 38.1% of females.
Males More Likely to Send Money Through Mobiles
Globally around 35% of the population aged 16 and older have sent money through mobile in the past year. The number of males that report doing this is almost 7 percentage points higher than females, with 38.6% of males stating they’ve sent money this way at least once in the last year, compared to the 31.7% of females that report the same thing.
Females Less Likely to Pay Bills Through Mobile
Slightly more than a third of the global population have paid a bill using their mobile phone in the last year, but when it comes to the differences between males and females, 37.0% of males say that they’ve paid a bill this way, whereas 31.8% of females say the same thing.
More Women Order Food Online than Men
Across all but one age group, a larger percentage of women order food online through websites and mobile apps than their male counterparts. Only in the 55 – 64 years age group do more men (15.1%) than women (14.3%) order food this way.
Men Across All Age Groups are More Likely to Buy Digital Content
While the majority of both males and females spend on digital content, a higher percentage of males across all age categories do so. The biggest portion is spent on movie, tv, and music streaming services.
M-Commerce by Region
United Kingdom & Europe
65% of British Shoppers Prefer to Use Mobile Shopping
The United Kingdom has one of the highest mobile phone adoption rates among adults of any country in the world, particularly in the under-34 years age category. With such high mobile phone adoption rates, it really isn’t surprising to learn that roughly two-thirds of online shoppers would rather do so using their mobile device.
Mobile Users in the U.K. Expected to Spend over $124 Billion by 2024
Retail sales forecasts are expecting m-commerce in the United Kingdom to total more than $124 billion by the end of 2024. This is being driven in large part by extremely high mobile ownership numbers, particularly in younger age groups. Under 24-year-olds, in particular, have an almost 100% mobile ownership rate.
80% of Shopping Carts Abandoned in the U.K.
Although a mobile device is the preferred shopping device for U.K. citizens, most (8 out of 10) shopping carts are abandoned. Users seem to be using their mobile devices mostly for browsing rather than completing an actual purchase. In actual fact, studies show that desktop devices have higher conversion rates and average order values.
Average Order Values Dropped by Approximately $14
The value of an average m-commerce sale in the U.K. peaked at almost $100 towards the tail-end of the pandemic but has since fallen by a considerable amount to a little of $86. However, this shouldn’t concern businesses operating in the U.K. too much, as the m-commerce industry is expected to keep expanding as younger demographics enter the consumer marketplace.
M-Commerce Will Contribute 40% to Scandinavian E-Commerce by 2025
The northern European countries of Denmark, Sweden, Norway, Finland, and Iceland share cultural and economic similarities, and this similarity can be seen in their use of mobile commerce too. 8 out of 10 Swedish shoppers shop online using their mobiles, and the other countries within that region are only marginally lower than that. The convenience of mobile shopping means that by 2025, m-commerce is expected to make up 40% of e-commerce, and desktop sales are expected to decline.
Sweden & Norway Prefer the Swish Payment System
Scandinavian countries seem to prefer local payment apps and services over larger international versions, such as PayPal. The Swish payment service is used by almost 80% of surveyed Swedish and Norwegian citizens.
U.S.
$387 Billion Spent on Mobile Retail E-Commerce
The amount that American consumers spent on retail via m-commerce has more than doubled from pre-pandemic levels to over $387 billion. Despite this huge increase in the amount of money consumers are spending, the amount that m-commerce contributes to overall digital commerce spending still hasn’t ever gone over 40%.
U.S. Retail Mobile Commerce Sales to Hit $710 Billion in Sales by 2025
At the time of writing this article, retail m-commerce sales in the U.S. have surpassed $431 billion for the year and are expected to increase by more than 80% over the next 2 years and be worth an estimated $710 billion.
Americans Love Amazon and Fast Fashion
Across the Apple App Store and Android Play Store, Amazon was the most downloaded mobile shopping app in America last year, with 35 million downloads. The second most popular shopping app was Shein.
All Age Groups Using Their Mobiles to Shop
Millennials and older Gen-Zers are the most likely to use mobile shopping apps to complete a purchase, but recent surveys show that even the 50 – 64 age group is using m-commerce. Slightly more than 20% of them report that they make a purchase with a mobile device at least one time a week. Even around 11% of those over 65 are doing it!
187.5 Million Americans Will Make Online Purchases Using Mobile Device by 2024
Surveys showed that by 2020 162.8 million Americans had made at least one online purchase using a mobile device. By 2024, experts predict that number will increase to 187.5 million and contribute to roughly half of all e-commerce sales.
Rest of the World
Mobile Spending Contributes to GDP More in Asian Countries

Mobile spending accounts for 0.18% of a country’s total Gross Domestic Product GDP, on average. However, countries throughout Asia outperformed that average pretty convincingly last year.
Thailand had a 0.18% contribution to GDP from mobile, and the top in terms of contribution to GDP are China, Hong Kong, South Korea, Japan, and Taiwan.
44.3% of Internet Users in South Korea Make Weekly Online Purchases
South Korean shoppers aged between 16 and 64 years old are the most prolific online shoppers anywhere in the world, with 44.3% saying they buy something online each week. For reference, in the U.S. the percentage is 32.2% and the global percentage is even lower at just 29.3%.
Of these weekly shoppers, 32.5% prefer to use a non-mobile device and 67.5% prefer to use their mobile phones. This is the highest percentage of mobile-only shoppers in the world, with Taiwan (62.5%), Malaysia & Philippines (61.5%), and South Africa (60.8%) making up the top 5.
M-Commerce Outpacing E-Commerce in Malaysia
With a smartphone penetration rate of 89%, it’s no shock to see that m-commerce is doing so well in Malaysia. It’s currently outpacing e-commerce and is expected to become an $8.9 billion market this year with a Compound Annual Growth Rate (CAGR) of 19.7%.
Malaysia Outlier in Asian Digital & Mobile Payments Use
Emerging markets in the Asian continent typically steer away from digital payments of all kinds and often prefer to use cash-on-delivery systems. Malaysia is an extreme outlier in this regard as 93% of the country’s e-commerce transactions are made through mobile & other digital payment platforms.
China Mobile Users Spend $58,070,000,000 in 3 Months
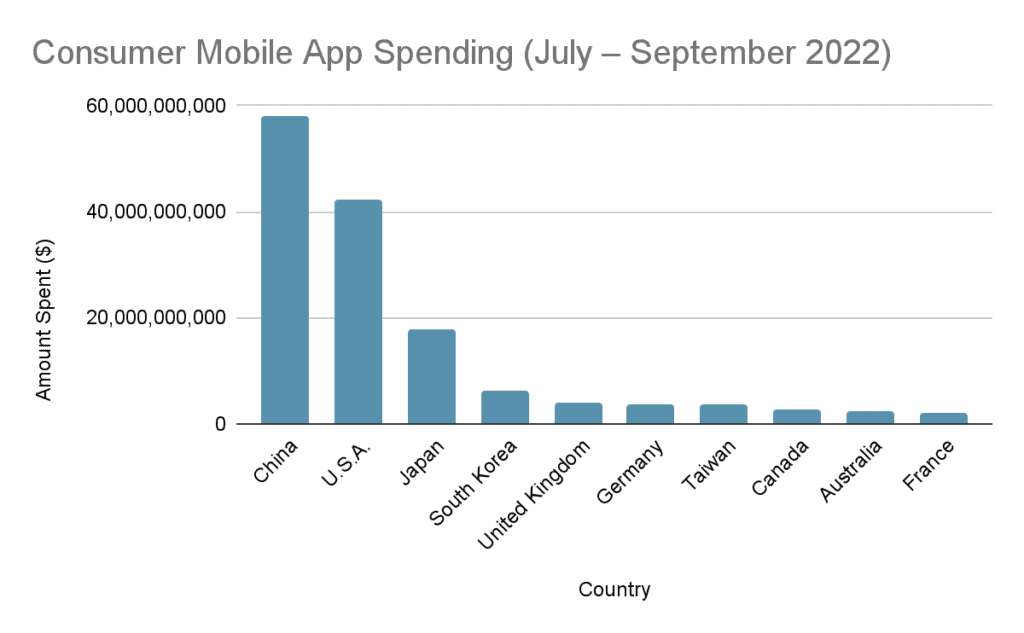
Chinese citizens spent almost $60 billion in the 3 months between July and September 2022. This makes China the country with the highest consumer spending on mobile apps. Part of this may be explained by Chinese citizens being under Covid restrictions longer than citizens of other countries. The United States of America was second during that period with $42,192,200,000 spent; and Japan came in third with a spend of $17,772,800,000.
China M-Commerce Market to Grow at 33.8% CAGR
By the year 2030, most experts predict that China’s m-commerce market will have reached a valuation of $727.9 billion with a Compound Annual Growth Rate (CAGR) of 33.8%. This is being driven by the widespread adoption of online payment platforms like WeChat and Alipay.
83.1% of China’s E-Commerce is M-Commerce
Broadly speaking, China’s population stepped over the desktop internet era and joined the internet once the smartphone era began to mature. This has led the country’s e-commerce industry to be dominated by mobile commerce. 2022 saw roughly 83% of all e-commerce be generated through mobile devices.
Japan M-Commerce Worth $36 Billion
Despite being known as an enthusiastic and early adopter of the latest technologies, Japanese consumers have been surprisingly slow to adopt mobile shopping habits. Despite this unusual reticence, smartphone use in the country is continuing to rise, and mobile commerce has more than doubled over the last 10 years with approximately half of the population stating that they’ve completed at least one mobile purchase within the last year.
65% of U.A.E Consumers Use Smartphones During Every Retail Journey
The United Arab Emirates has one of the highest smartphone penetration rates anywhere in the world (some estimates put it as high as 95% of the adult population) and consumers are putting their smartphones to work whenever they shop online or in a brick-and-mortar store. 65% say they’ve used their phone for at least part of their shopping journey, while an impressive 33% report that they completed their last purchase entirely through their mobile phone.
U.A.E. Shoppers Encounter 9% More Friction Than Other Countries
In the U.A.E., in-store shoppers who use their mobile to complete orders and make payments report encountering difficulties with the process 9% more often than consumers from other countries. Although the exact reasons for this are unclear, one area that definitely needs improvement is the in-store collection of pre-purchased goods. U.A.E. consumers that shop this way are 35% more likely to encounter difficulties collecting their goods than similar shoppers from other countries.
African Continent Uses Mobile Payment Systems More Than Credit Cards
The African market is unique in that credit cards are a payment type that’s still relatively uncommon for the majority of the continent’s citizens. However, data on the volume of transactions facilitated by digital payment systems shows that the popular mobile wallet M-Pesa was used more frequently than any credit card.
M-Commerce Sales in Brazil Expected to Grow by 74%
From January to December 2022, m-commerce sales in Brazil totaled approximately $30 billion and are expected to increase by 74% by 2028 to reach total sales of $52.2 billion.
Mobile Shopper Behavior Statistics
iOS Users Use Shopping Apps More than Android Users
This shouldn’t surprise anyone, as we’ve known for a while that iOS users are generally more willing to spend money, tend to come from the most affluent countries, and have more disposable income.
Between January and December 2022, shopping category apps were the 7th most downloaded in the Google Play store, whereas they were the 5th most downloaded app category for iOS users.
2.7% of Mobile Time Spent on Shopping Apps
Mobile phone owners are using their phones for an average of 5 hours per day as of 2023. Of that time spent on their mobile phones, 2.7% of that time is spent using shopping applications. This equates to roughly 8 minutes per day spent on shopping apps.
$167.1 Billion Spent on Mobile Apps
Between January and December 2022, consumers spent approximately $167.1 billion through mobile apps. This is actually a decrease from a year earlier with consumers spending $2.9 billion less than the previous year, which is a 1.7% reduction.
$100 Average Spend
The average American consumer spends an average of $94.85 per m-commerce purchase made with a mobile phone and $101.96 when purchasing with a tablet.
The global average spend per m-commerce purchase is much lower at around the $25 region, but this is to be expected as emerging and developing markets are strong mobile commerce users and typically have lesser spending power than more advanced economies.
83% of Consumers Use Shopping Apps While in the Brick-&-Mortar Store
Consumers love using shopping apps and that includes while being in a brick-and-mortar store. The reason given by most consumers is that they like to compare online with in-store prices and to check on deals and discounts. Another reason given for this behavior is consumers wish to see the desired shopping item in person before they commit to purchasing it online later.
23.6% of Adults Ordering Food Takeaway & Delivery Online

Ordering a takeaway or food delivery couldn’t get much easier with numerous available food delivery and takeaway apps. Today, 23.6% of internet users aged 16 to 64 years old worldwide are using websites and mobile apps to order food.
For some countries that figure is significantly higher, with the top 5 countries having more than 35% of adult internet users ordering food takeout in this way.
A Quarter of Adult Internet Users Access Fitness & Health Websites & Mobile Apps
Globally, the health and fitness industry has had a massive boom, especially as people have reassessed their lives during the Covid pandemic. Last year saw 24.1% of the world’s adult internet users access fitness and health websites and apps. The U.S. population fell below the worldwide average with just 22% of adults paying for mobile health and fitness services. Nigeria was the best performer in this category, comfortably beating the global average with 35% of the adult internet population reporting making a mobile purchase within the industry.
55% of Mobile Shoppers Complete Purchase After Seeing Product on Social Media
This shows just how important it is to have well-made mobile-first storefronts and a good social media presence. Social media users are often some of the heaviest users of other mobile services. Studies show that a little more than half of the mobile shoppers that completed a purchase with their mobile did so after seeing the product on their social media channels first. This includes consumers that use social media as a research tool to help them make purchasing decisions.
Mobile Commerce Payment Statistics
45% of Total B2C E-Commerce Transactions Were Digital or Mobile Wallet Transactions
Of the business-to-consumer transactions made during the last year, almost half were attributable to digital and mobile wallet transactions, with forecasts predicting that will continue to rise as more countries develop digital currency and payment infrastructure.
Quarter of the Globe’s Internet Users Have Used a Mobile Payment System
25% of the world’s internet users aged between 16 and 64 use at least one type of mobile payment service. However, some countries have much higher adoption rates, like the U.S. (27.3%), U.K. (28.9%), and Brazil (32.4%).
PayPal Is America’s Favorite Mobile Payment Service
PayPal has been the online payment system of choice for many internet users for a number of years now and is regarded as safe, reliable, and relatively inexpensive to use. Perhaps because it is regarded so well by desktop online shoppers is the reason that it took the top spot in terms of the most widely used mobile payment system in the U.S. last year.
U.K Citizens Prefer Apple Pay
When asked “Which payment services have you used in the past 12 months to pay in stores, restaurants, or other points of sale with your mobile device?”, most people said that they’d used Apple Pay. Masterpass by Mastercard was the least used mobile payment service.
10.2% of Population Aged 16+ Have Mobile Money Accounts
Mobile money accounts (also referred to as electronic wallets) have grown in popularity in several countries as the internet has matured and is safe for users to transfer money without the need for traditional bank accounts. Today, 10.2% of the global population aged 16+ years owns or uses one of these services.
Males Made More Digital Payments
58.8% of the worldwide population has made at least one digital payment in the past year, with males making up the majority. 62.4% of males surveyed stated that they’d made a digital payment in the last year. The reasons for the disparity are unclear; however, contributing factors could be the different ways that the sexes approach shopping, and/or because males are statistically more likely to own and operate businesses that are likely to require the transfer of payments to employees, creditors, and suppliers.
$5.5 Trillion Global Mobile Payment Market Valuation
Current estimates suggest that the mobile payment market is valued at approximately $5.5 trillion globally. By 2028, experts predict it will reach a valuation of $20.48 trillion, growing at a compound annual growth rate (CAGR) of 30.7%.
Digital Wallets Will Account For 52.5% of E-Commerce Payments by 2025
More than half of the globe’s e-commerce transactions will be completed using some type of digital wallet by 2025, roughly 3% more than there is currently. This will be led by Asia-Pacific markets that already have very strong mobile and digital wallet systems and adoption rates but will also be buoyed by increasing use in Europe and the U.S. brought on by lockdown restrictions.
Nordic Countries Ready to Go Cashless Within 5 Years
Norway, Sweden, Finland, and Denmark are four of the most cashless countries in the world today. Over the last decade, citizens in these countries have gone from using cash for 40% of their consumer spending to just 10%. This is being driven in large part by the widespread adoption of local digital and mobile payment systems. In Sweden for example, the mobile payment system Swish is almost universally used by the population, and some experts are even predicting that the country could be cashless later this year!
Two-Thirds of Americans Expect to Have Mobile Wallet This Year
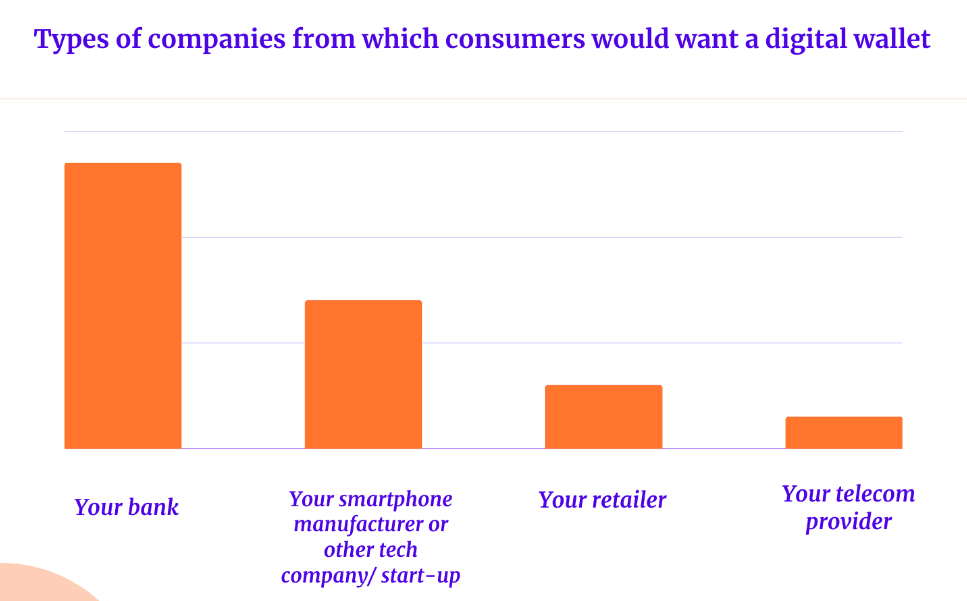
Surveys of the American public show that approximately 66% of consumers expect to hold a mobile wallet by the end of this year, and 54% of consumers state that they would prefer that wallet to be issued by their bank, or by their smartphone manufacturer.
Mobile Commerce During Covid-19
80% of Shoppers Say They Shopped on Mobile More Often
The Covid lockdowns initially slowed consumer demand down but as the pandemic restrictions remained in place longer than many people initially assumed they would, consumer spending began to rebound. Studies show that 8 out of every 10 online shoppers reported using their mobile devices for shopping more than they had done prior to the pandemic.
38% of U.S. Shoppers Said They Shopped Using Their Mobile at the Start of the Pandemic
Pre-pandemic, mobile wallet use in America was relatively low with just 38% of consumers stating that they used one. During the height of the Covid pandemic lockdown protocols, that number jumped to approximately 55%. Once normal activities resumed the use of mobile wallets did fall slightly, but overall, mobile wallet use in the U.S. has now been pushed into the mainstream in a way that prior to the pandemic, only Asian markets could achieve.
Pandemic Boosted Time Spent on Mobile Shopping App by 51.7 Billion Hours
Prior to the pandemic the total amount of time consumers spent on mobile shopping apps sat at roughly 64 billion hours worldwide. By the end of the following year, when Covid restrictions were in full effect, time spent on mobile shopping apps had increased to approximately 85 billion hours. Today that figure stands at well over 100 billion.
Frequently Asked Questions
How Many People Shop Online?
An estimated 2.3 billion consumers shopped online at least once last year.
How Much E-Commerce Is Mobile?
Depending on the source, this could be as low as 55% or as high as 73%. Our research for this article finds an average of ~60% of e-commerce is mobile commerce.
How Much Is Mobile Commerce Worth?
Estimates value the global mobile commerce market at $1.1 trillion.
How Many Retailers Have a Mobile Commerce Website?
Current estimates vary pretty significantly depending on the market region, with retailers in Asian markets often having strong mobile commerce offerings. Current global estimates suggest that somewhere in the region of 47%-75% of retailers in developed markets have a mobile commerce website.
Sources
J.P. Morgan, Visa, PayPal, Amazon, SimilarWeb, Pew Research, Statista.


