Reputation management is a feature inside the GoHighLevel platform that lets you manually or automatically request reviews via email or SMS.
You can also view and respond to Google My Business and Facebook reviews to see detailed analytics.
US-based businesses can integrate with Yext to view reviews from other sources.
Key Takeaways:
- Request, respond to, and analyze reviews from the GoHighLevel platform
- Automate the review request process
- View reviews from Facebook and Google My Business and integrate with Yext
What Is GoHighLevel Reputation Management?

Online reviews can make or break a business.
However, monitoring and responding to reviews can be tough to keep on top of.
GoHighLevel makes this easy by providing an area on its platform where you can manage Google and Facebook reviews, send out review requests and respond to existing ones.
You can also view at a glance what the overall reputation of the business is and identify how to improve.
What Are the Benefits of GoHighLevel Reputation Management?
Around 90% of online buyers read reviews before they make a purchase.
That means it’s crucial to maintain an overall positive review score as it helps convince shoppers to buy from your business.
GoHighLevel allows you to increase the number of positive reviews you receive by sending out review requests to existing customers.
The more reviews you get, the better your score will be and the more credibility you build with your audience.
Furthermore, since you can immediately see when a new review is posted, you can take quick action if you receive a negative one.
Reaching out right away to solve the problem presents an opportunity to get the review score adjusted if the customer is happy with the outcome.
Finally, receiving a high quantity of reviews allows you to spot where you can improve your business.
You can spot recurring problems, such as inaccessible customer service or a need for price adjustments.
By identifying these problems through the reviews you receive, you can quickly make changes to your business and improve the customer journey.
How to Use the GoHighLevel Reputation Management Feature

To use the GoHighLevel reputation management feature, you must first head to the Integrations tab and set up the Google My Business integration.
If you want to also receive Facebook reviews, you need to integrate GoHighLevel with your Facebook business page.
To set up both Google My Business and Facebook, click on the Connect button and follow the instructions.
When you’ve completed the setup process, you can start receiving reviews on the GoHighLevel platform.
Send Google Review Requests Manually via a Unique Link

If you click on Settings while in Reputation Management, you can quickly set up SMS and email templates for your Google review requests.
Here you can write the request in the box provided, and GoHighLevel will automatically generate a link for the user to click on.
You can also add an image to make the request stand out more.
Once your templates are complete, you click Send Request, add the contact’s name along with their email address or phone number, and the review request will be immediately sent.
Automate Review Requests

Rather than sending out manual review requests, you can automate the entire process by setting up a GoHighLevel workflow in the Automation tab.
Create a trigger event, like “Order Fulfilled.” Then, set the subsequent action as “Send Review Request.”
Your review request text or email will automatically send whenever the customer receives their order.
You can customize workflows to precisely match your requirements.
For example, if you sell online courses, you want the customer to have the chance to try out some of the course material before sending out a review request.
In this case, you can set the request to be sent a week or two after the purchase is made.
Manage and Respond to Existing Reviews

Responding to existing reviews is quick and easy, meaning you can address any issues as soon as they arise.
All your reviews are listed under the Reviews tab in Reputation.
Next to each review is a blue Respond button.
Click it, and you’ll immediately be able to write and send a response.
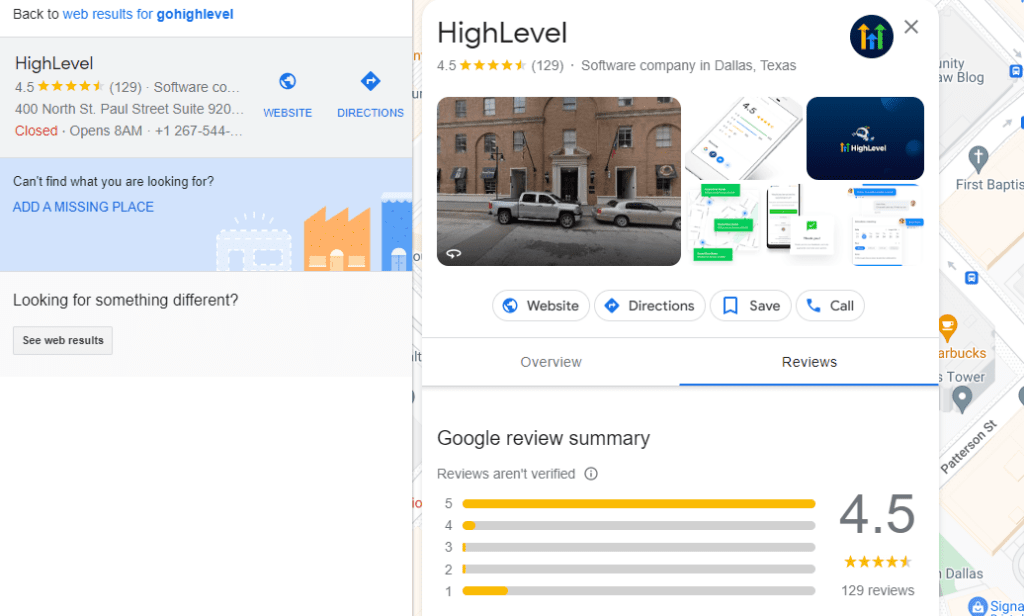
View Analytics for Facebook and Google My Business Reviews

At a glance, you can see how your reputation is performing based on the reviews that come in.
There are several different areas to look at:
- Invite goals: These are predetermined and increase incrementally as each goal is achieved. This is set by GoHighLevel and can not be edited.
- Reviews received: A snapshot of the total reviews received from Google and Facebook.
- Online listings: If you are using Yext, this is where you can see an overview of the data.
- Average rating: The average number of stars based on all received reviews.
- Sentiment: A snapshot of how customers are feeling in general about the business.
- Invite trends: The total reviews requested across SMS and email within the given time frame.
- Review trends: A bar graph displaying reviews received month-to-month.
- Latest review requests: A list of who has received review requests.
- Latest reviews: A list of all recent reviews received.
Embed the Review Widget into Web Pages

You can display recent reviews on a website, sales funnel, or landing page via the review widget.
In the Settings tab of the Reputation area, scroll to the bottom to customize the widget.
Here, you can adjust the colors and write your own header for the widget. You can preview what it will look like on different devices.
You will also find the HTML code for the widget, and all you need to do is copy and paste it onto the desired web page.
If you’re using the GoHighLevel web page-building tools, the widget is accessible under the Elements section.
Simply drag and drop the widget onto the page, and the information will display.
Send and Manage Review Requests via the GoHighLevel Mobile App
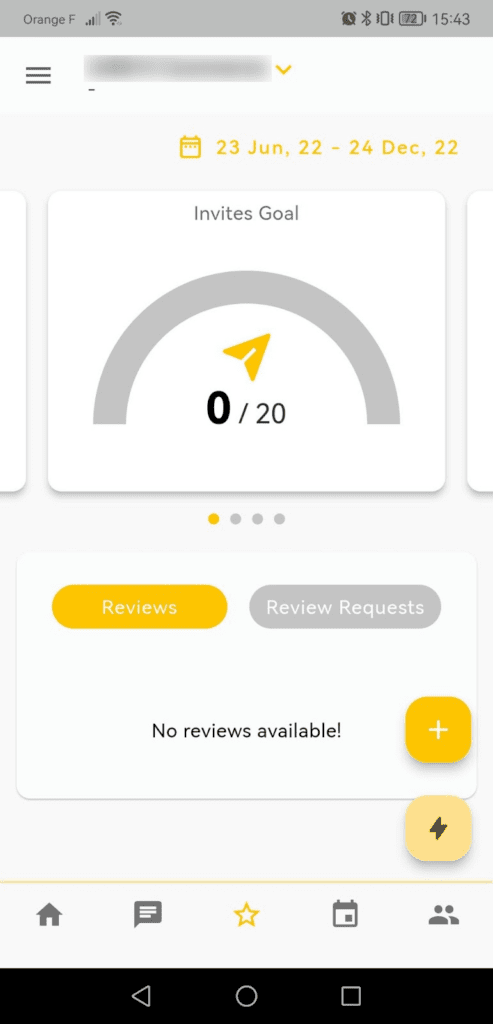
The GoHighLevel mobile app is handy for performing CRM while on the move.
It allows you to view your reputation stats and send out review requests via email or SMS.
When reviews come in, you can also click to respond if necessary.
Integrate with Yext for Enhanced Reputation Management
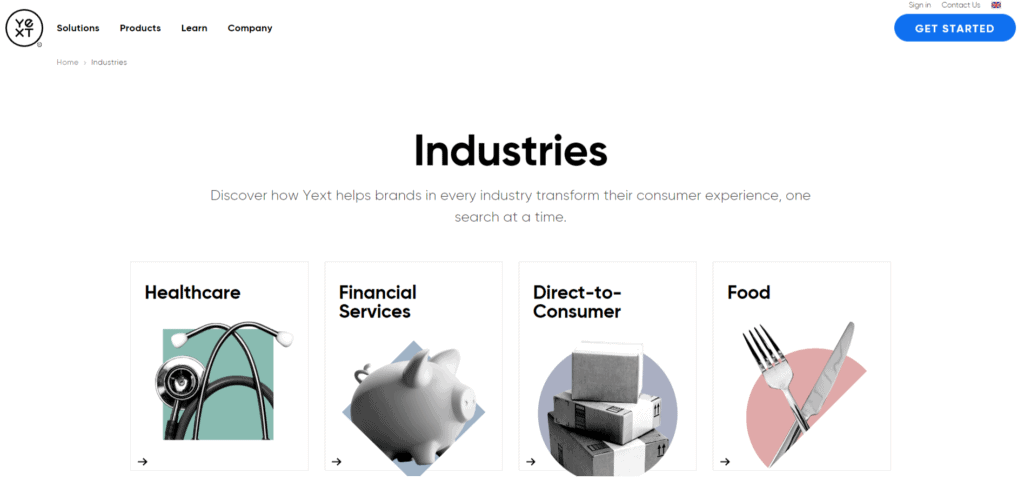
Yext is a third-party service that you can use with GoHighLevel to manage your business details and reviews across 150+ listing sites.
This allows you to ensure that the contact details and information about the business are kept up to date across the board and allows you to keep tabs on reviews coming in from sources other than Google My Business and Facebook.
How to Use Yext with GoHighLevel
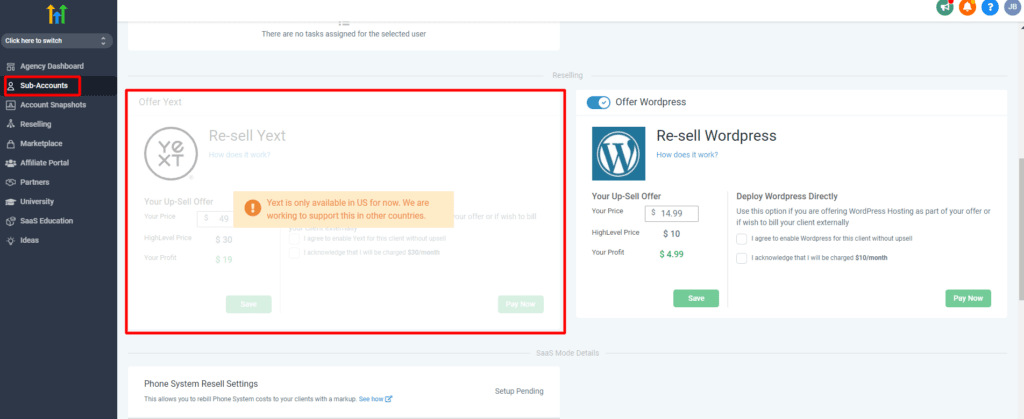
Yext is set up on GoHighLevel as a resale service.
Therefore, you can find it as an option in each of your sub-accounts.
GoHighLevel has secured a monthly fee of $30 for the service, but you can sell it to your clients for whatever price you choose.
Once the service has been purchased, the information will display under the Listings tab in the Reputation area.
You Might Also Like:
Frequently Asked Questions
What Is GoHighLevel Reputation Management Used for?
GoHighLevel reputation management allows you to send out reviews requests via email or SMS. This can be performed manually or by automation.
The platform also lets you respond to reviews and view the analytics for all received reviews.
Can I View All Reviews on GoHighLevel?
You can view all reviews received from Google My Business and Facebook if you have connected the accounts with GoHighLevel.
To view reviews from other sources, you need Yext. However, this is only available to businesses based in the USA.
Can I Delete Bad Reviews on GoHighLevel?
You cannot delete bad reviews from GoHighLevel. However, you can flag an inappropriate review for dispute on GoHighLevel but only if the review request was originally sent from GoHighLevel.
Reviews not requested from GoHighLevel must be disputed in Google.